All Images
Introduction
Figure 1
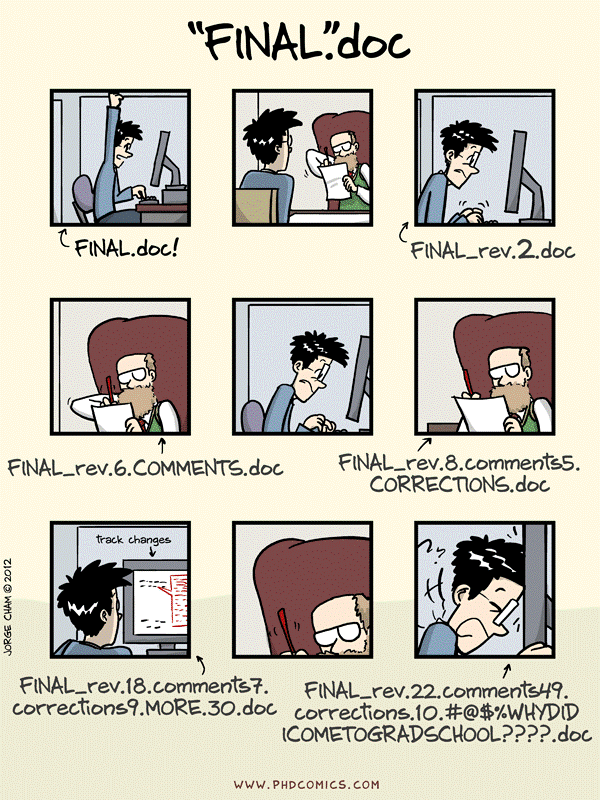
Image 1 of 1: ‘This image shows the many different levels of data that biologists might work with. On the highest level, they work with organisms, shown in the image are a wasp, a tree, and a bacteria. On an intermediate level, they may collect raw data from these organisms. Shown in the image are a picture of dividing yeast cells, a western blot, and a floppy disk containing text data. On the final level, they will have visualisations of the raw data. Shown in the image are a picture of dividing cells with fluorescence at the boundary, a bar plot, and a cartoon of gene transcription.’
Data Management
Figure 1
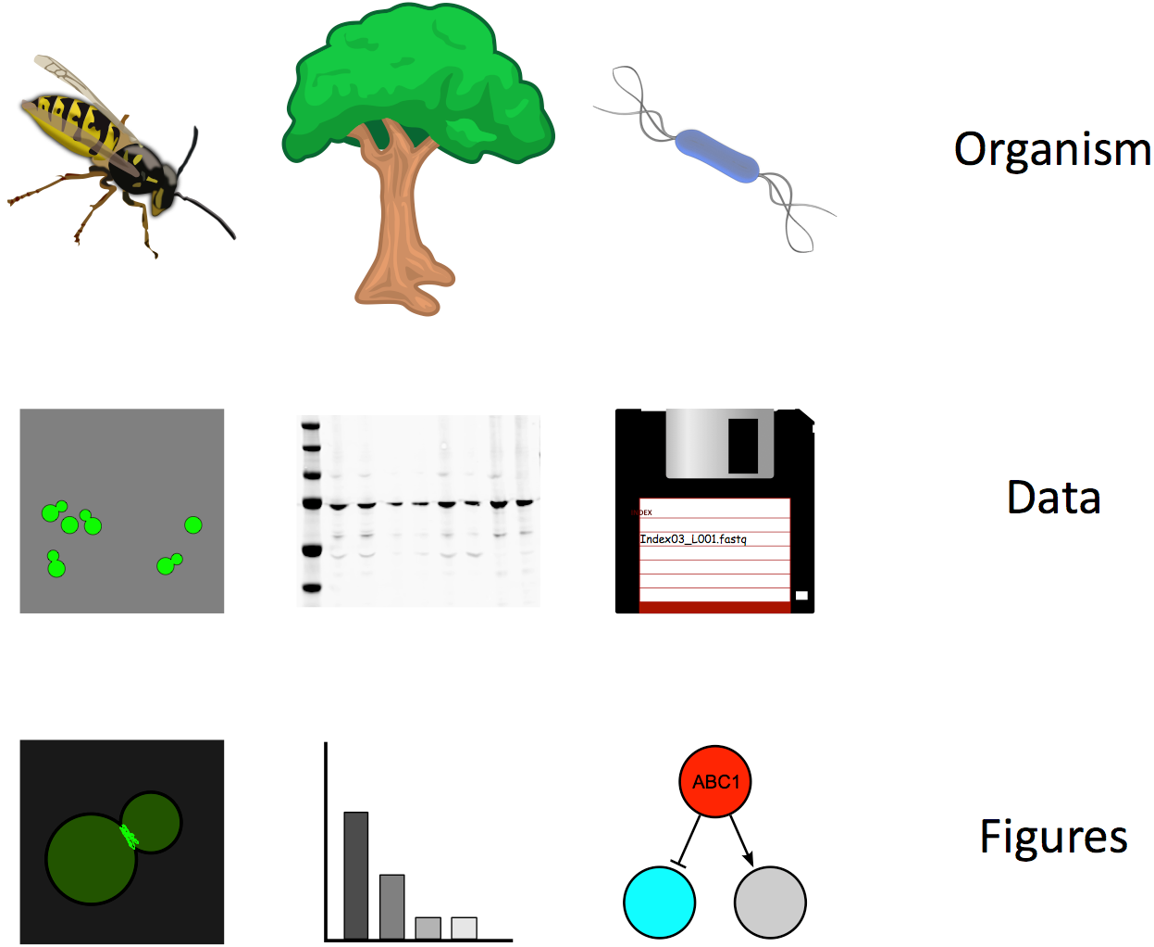
Image 1 of 1: ‘A comic strip titled 'The four stages of data loss' and subtitled 'dealing with accidental deletion of months of hard-earned data' by PhD Comics. It's based on the common theory of five stages of grief. The first panel is labelled 'stage 1: denial' and shows a man sitting behind a computer. A thought bubble above his head reads 'I did not just erase all my data. I surely made a back-up somewhere'. The second panel is labelled 'stage 2: anger' and shows the man shaking his computer. A speech bubble above his head shows he is shouting 'you stupid piece of crap! Where's my data?!'. The third panel is labelled 'stage 3: depression'. It shows the man crying, the broken computer beside him. He thinks 'Why? Why me?'. The fourth and final panel is labelled 'stage 4: acceptance'. It shows the man coming to terms with what has happened. He says 'I'm never going to graduate'.’
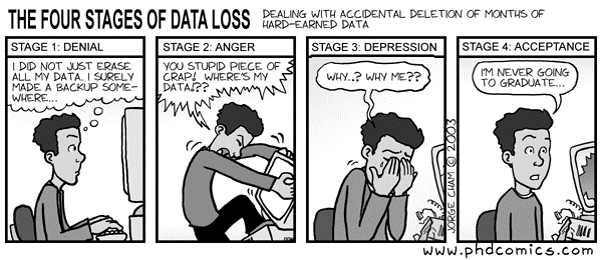
Figure 2
Image 1 of 1: ‘Two tables of data appear side-by-side. The table on the left has columns named site, 1999, and 2000. The table on the right has columns named site, year, and cases.’
Which of the table layouts is analysis friendly? Discuss. Enter your
answers in the collaborative document. 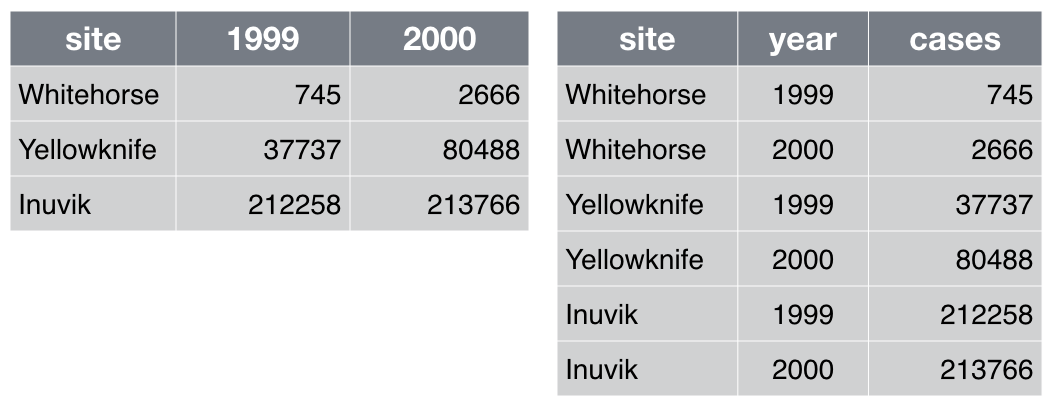
Code and Software
Figure 1
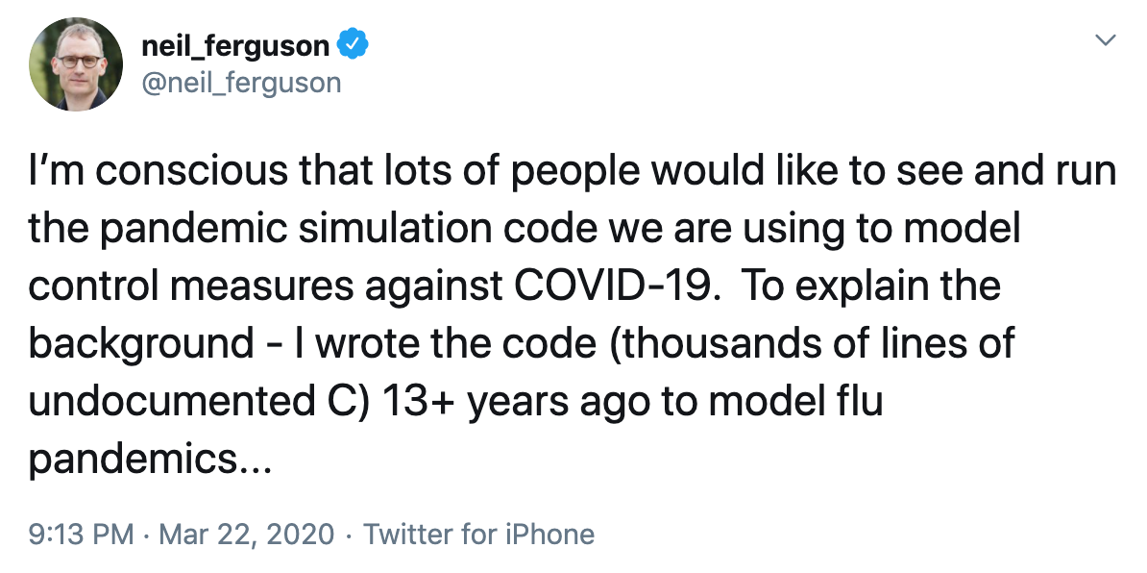
Image 1 of 1: ‘A tweet from Neil Ferguson, posted on March 22nd 2020. It reads 'I'm conscious that lots of people would like to see and run the pandemic simulation code we are using to model control measures against COVID-19. To explain the background — I wrote the code (thousands of lines on undocumented C) 13 plus years ago to model flu pandemics…'’
Collaboration
Project Organization
Keeping Track of Changes
Figure 1
Image 1 of 1: ‘A comic strip titled "final.doc" by PhD Comics. The first panel shows a student saving a document on their computer and naming the file "final.doc". The second panel shows their professor editing the document on a printed piece of paper. The third panel shows the student making the edits and naming the new document "final_rev2.doc". The fourth to ninth panels go back and forth between the professor and the student, with increasingly complex file names. By the end the student is exasperated and hitting their head on their computer screen.’